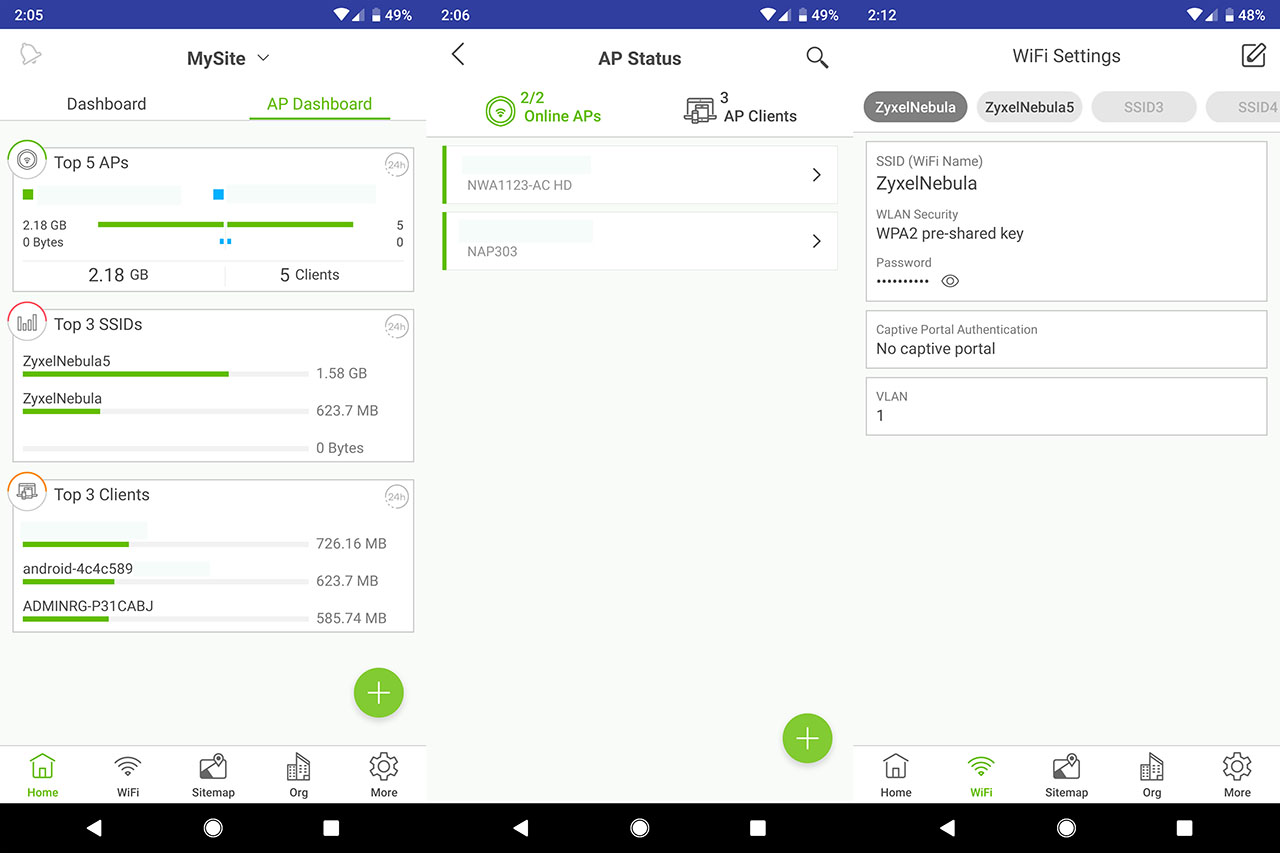
If you slide to the AP Dashboard, you’ll be able to see the Top 5 APs, the Top 3 SSIDs and the Top 3 Clients. If you tap on the AP Status, it will display a list of the connected access points and if you click on the name, it will display some detailed info about the device. Still under AP Status, tap on the AP Clients to see a list of all connected client devices: if you click on any of them, it will take you to the Details page, where you can see more detailed info about the client and you can Apply a specific Policy to it (can be Normal, Whitelisted or Blocked). The Nebula app also offers the possibility to change the WiFi Settings, where you can configure the SSIDs for all the connected APs (includes using the Captive Portal).
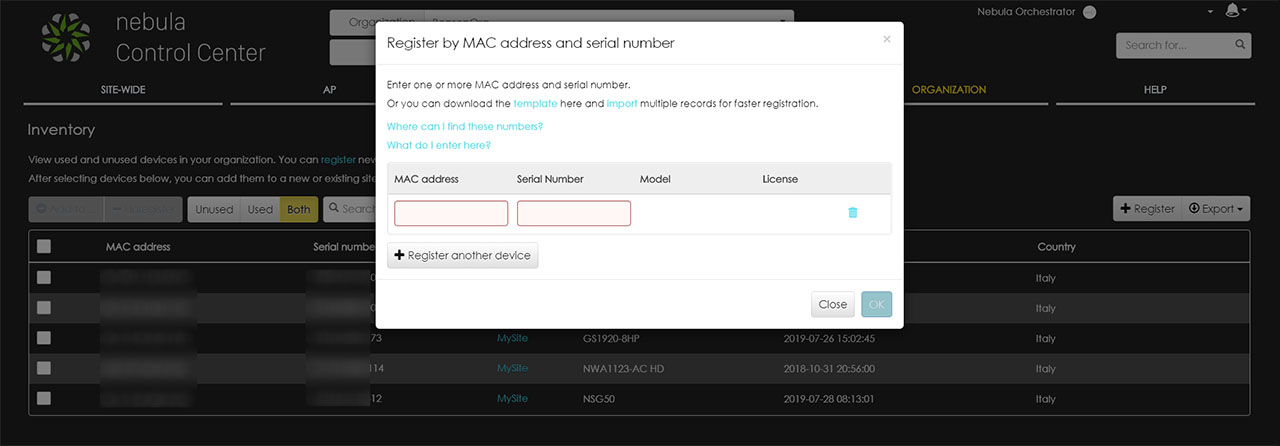
The Nebula app is a great tool for basic configuration, but the true monitoring and managing can only be done from the web-based interface which can be accessed by going to the https://nebula.zyxel.com (enter it in the URL section). If you haven’t added the NAP303 from the Nebula app, you can within the Nebula Control Center and all you have to do is to go to the Organization section and select Inventory from the drop-down menu (it’s going to be a part of the Config group). Afterwards, click on Register+, add the Serial Number and MAC address and, lastly, don’t forget to add the newly registered device to the Site (there’s a small ‘Add to’ button on the left).
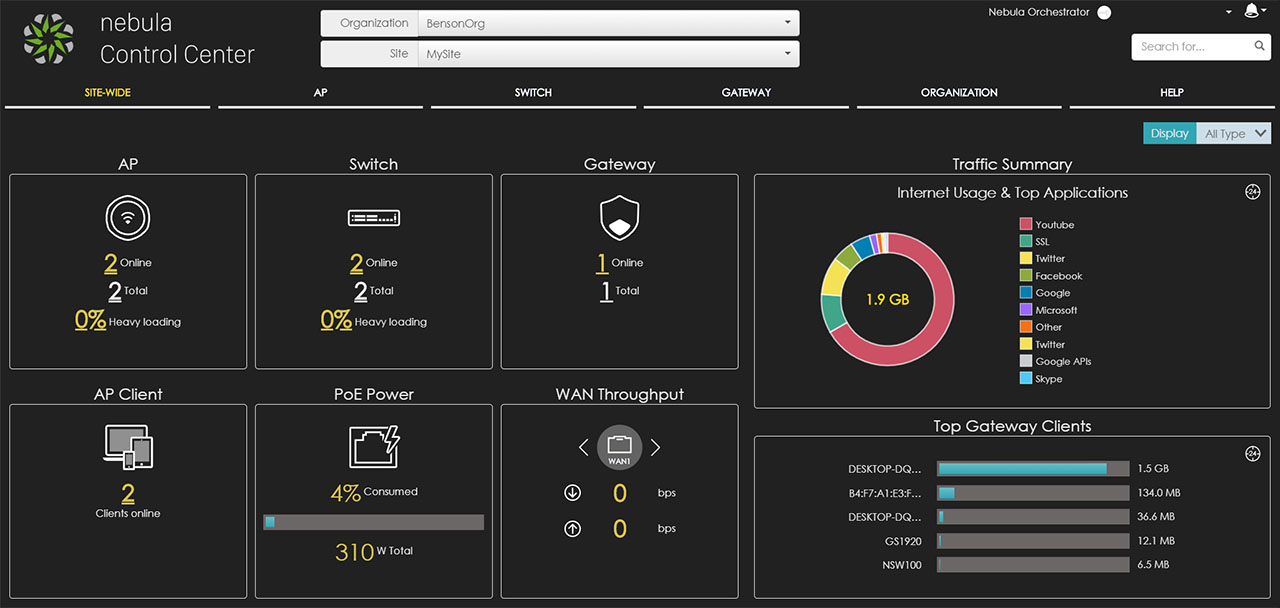
When accessing the user interface, the first window that you’re going to see is the Site-Wide Dashboard, where there are dedicated blocks for each type of devices, the first being the AP (which includes the number of total access points, the ones that are online and the Heavy Loading), followed by the Switch and Gateway sections, while underneath there’s the AP Client block (which shows the total number of online Clients) and the PoE Power (the total drawn power by the access points + the available PoE budget) – to the right, you can see the Traffic Summary with the Internet Usage and the Top Applications. To access the AP area, you can select it from the top menu or directly click on the AP block from the Dashboard: it will take you to the Summary report (part of the Monitor group) where you can see various stats (including the Top APs by usage and the Top SSIDs).
If you’re familiar with other network controller, you can see that Zyxel has adopted a different approach and instead of opening additional small windows for more info and configuration in a modular manner (such as the case of the Ubiquiti UniFi and Open Mesh Cloudtrax), it simply takes you to a new section of the UI.
That being said, still under Monitor, you can see a list of all the registered wireless access points and by clicking on any of them, it will show you more info about the device, its position on the Map (useful if you have your devices deployed in multiple locations) and Zyxel has also added some Live tools to help you see the live traffic, to Ping an IP address, to run Traceroute tests, to Reboot the access point or to run the Locator LED (it will flash to help you find the device).
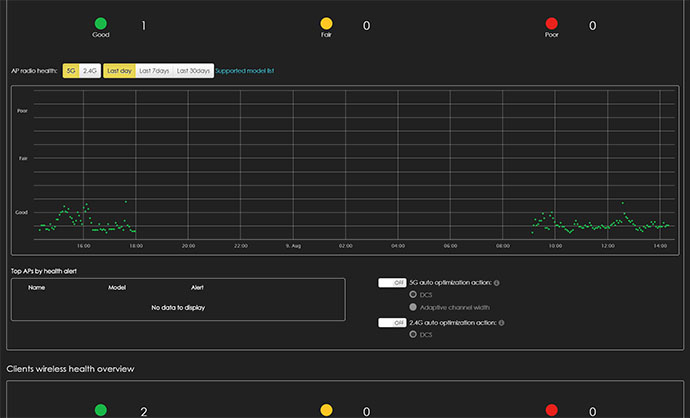
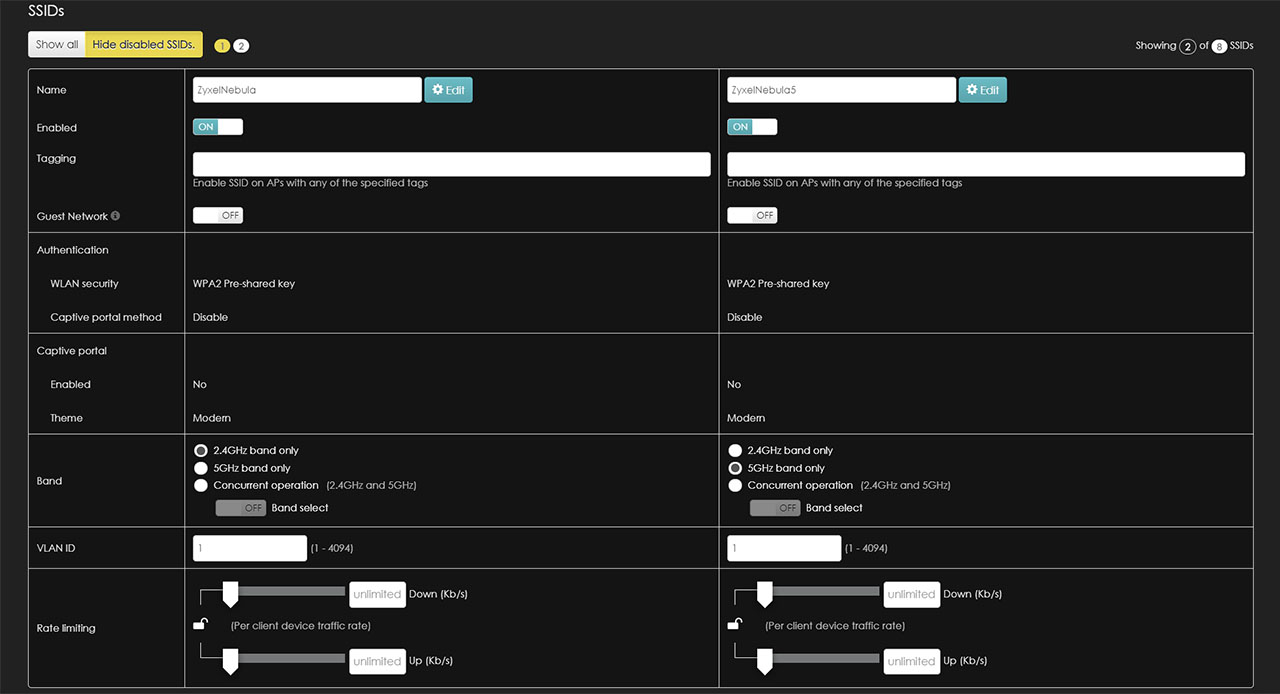
Still under Monitor, there’s the AP area, where you can find a list of all the connected clients (click on any of them to view more info and to see the position on the Map – you can also Ping it), the Event Log which will show you any event that happened within a certain period of time, the Summary report and the Wireless health which, at the moment is in beta, but it displays some unique info: a graph to show the AP wireless health overview (here you can also enable the 5G and 2.4G DCS auto optimization in case there are too many connection errors) and a graph to show the Client wireless health overview (includes the possibility to auto optimize the client connection). The Configure group allows you to set up the global SSIDs – when I tested the Zyxel NWA1123-AC HD, I made two separate SSIDs, each with its own settings and, after I added the NAP303 to the Nebula Control Center, the configuration was immediately applied to the new AP (this is only site-wise, so every site will have a different set of settings).
Underneath the SSIDs, there’s the SSID schedule and the Authentication, where you can adjust various aspects of each SSID, such as the Visibility, the type of WLAN security (don’t leave it Open if you care about the security of your network – here you can enable the 802.11r Fast Roaming), the Captive portal (either view and agree the captive portal to access the network or Sign in using the Nebula cloud authentication, the RADIUS server, Facebook or Facebook WiFi), enable the 802.11k/v Assisted roaming (it will work only with compatible clients), the U-APSD (a QoS facility which is very useful to save power for any battery-powered client), the Walled garden, the Layer 2 isolation (blocks unlisted clients from communicating to other connected clients) and the Intra-BSS traffic blocking (prevents crossover traffic from within the same SSID).
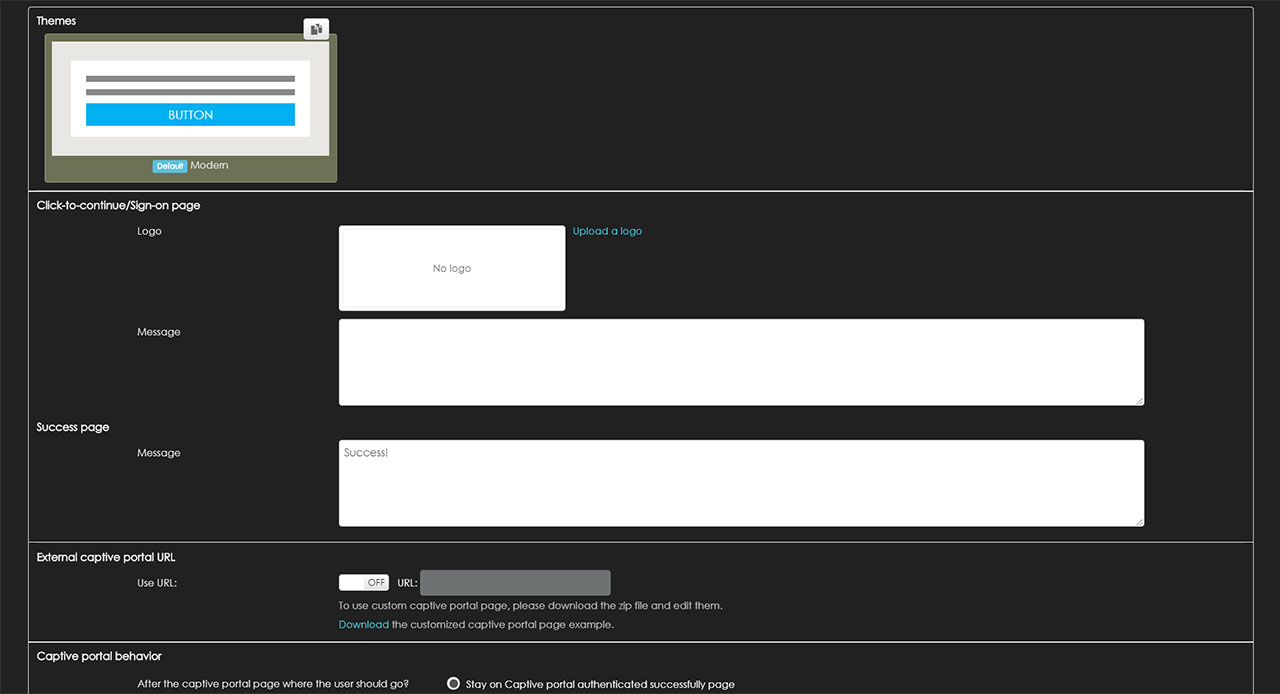
The Captive Portal is also an important part of any access point, allowing its users to adjust the Theme, to enter custom messages, to set what happens after you have successfully authenticated and more. Still under the Config group, there’s the Radio setting, where you can adjust the Country, the Maximum output power, the Channel width, the DCS setting and more (on the bottom, you can personalize the settings for each access point); there’s also the Client steering where you can enable the Load balancing (you can choose between ‘By client device number mode’ and ‘the Smart Classroom mode’, the latter being suitable for E-learning) or the Smart steering (this function has the role of steering the clients to the access point with the better signal).
Lastly, there’s the Port setting where you can configure the three available LAN ports. Some other access point-related areas can be found under the Site-Wide section, such as the Summary report (includes the Top SSIDs by usage), the Topology (it shows a graphical representation of your network), the General setting (where you can set the Captive portal reauthentication schedule) and the Firmware management, where you can upgrade the firmware of the NAP303 immediately or create a schedule for when it will be updated.
Conclusion
The Zyxel NAP303 has everything that it needs to be one of the best performers in its category, offering a solid wireless performance, a good heat management and lots of advanced features, including the adaptive smart antenna which helps a great deal with the interference (it’s also the reason why the case is so thick), the mesh technology and other options to ensure the stability of the network. Still, one of the best thing about the NAP303 is the integration to the Nebula environment which makes the process of monitoring and configuring the access point surprisingly intuitive, especially after becoming more accustomed to the way Zyxel has designed the NCC interface.
I know that a Cloud-only management environment is risky because it is dependent to the the software support and on the longevity of the manufacturer, but it does seem that this is the road taken by all major manufacturers, so we will most likely see an increase in popularity towards this type of approach instead of a return to the stand-alone (or on-site) monitoring software (if you still worry about it, the NebulaFlex series is a reliable alternative).

Mark is a graduate in Computer Science, having gathered valuable experience over the years working in IT as a programmer. Mark is also the main tech writer for MBReviews.com, covering not only his passion, the networking devices, but also other cool electronic gadgets that you may find useful for your every day life.

